
Investment Update Q3 | 2023
Q3 Investor Letter
We begin this letter by expressing our profound shock and sadness at the appalling acts of terrorism perpetrated by Hamas against the State of Israel and its people. There can be no justification for wanton violence against civilian populations which appears calculated to disrupt a Saudi-Israeli rapprochement while creating conditions that could draw other regional actors into conflict. We stand with Israel and unequivocally reject the notion that Hamas’ actions represent the will of the Palestinian people who will undoubtedly bear the brunt of Israel’s efforts to ensure safety for its people.
Market Overview
Equity and fixed income markets fell during the Q3 following a strong first half. Labor market resilience and better-than-expected economic growth would normally be a good thing but strength heightened concerns that the Federal Reserve would maintain restrictive policy for an extended period. The “higher for longer” narrative discomfited those investors who had anticipated a potential Fed rate cut as early as late 2023.
For the quarter, the S&P 500 fell 3.5%, in line with the NASDAQ 100 Index, down 3.8%. Year-to-date, these benchmarks rose 12% and 28%, respectively. Rates rose sharply during the quarter, driving marked underperformance for fixed income, particularly at the long end of the curve. Ten-year treasuries fell 4.8% while the 30-year bond dropped an eye-popping 12%.

Source: Standard and Poors, RAM Research
Sentiment around Fed policy and the direction of interest rates dominated market action during the Q3. Commodities rose 15% propelled by a 30% rise in the price of oil. Unsurprisingly, the energy sector rose in tandem and was the only S&P segment to post a positive return for the period.
Style-wise, both large and small-cap indices declined during the quarter with large value and growth turning in comparable performance - each down between 3 - 4%. Small-cap growth, however, underperformed dramatically, down nearly 8% for the quarter as measured by the Russell 2000 Growth Index.
The decline in the Q3 notwithstanding, US equities continue to outperform global benchmarks with the S&P 500 up 12% year-to-date, Europe, Asia-Pacific and Emerging markets advanced 7%, 5% and 2%, respectively over the same time frame.
Currently, the S&P 500 Index is trading at 17.1 times the CY 2024 earnings forecast of $250 and 15.8 times the CY 2025 estimate, representing an earnings yield of 5.8%. This compares to the current ten-year treasury yield of 4.6% and implies an equity risk premium of 120 basis points, substantially lower than in recent years and the long-term average of 160 basis points; a reversion to the long-term average would suggest a fair value of around 16 times forward earnings and a near-term price target of 4320 for the S&P 500 Index, 2% higher than current levels. As such, we expect the broader market to remain range-bound in the near- to intermediate-term, an environment particularly well-suited for our research-driven investment approach.
The Economy
Since the dramatic rebound from the depths of pandemic-related contraction, the strength of the U.S. economy has exceeded expectations. Following a decade of already accommodative monetary policy, the Federal Reserve and the U.S. Treasury teamed up to turbo-charge growth in an effort to combat the adverse economic effects of COVID. The Fed doubled the size of its balance sheet, thereby injecting cash into the economy while fiscal stimulus approaching $5 trillion spurred spending by consumers and businesses alike.
Balance Sheet of the Federal Reserve: $4 Trillion to $9 Trillion

Source: St. Louis Federal Reserve
The result, unsurprising to those familiar with the laws of supply and demand, was a dramatic pick-up in core inflation, which peaked at nearly 7.0% in July 2022.
12-month percentage change, Consumer Price Index, All Items ex. Food and energy
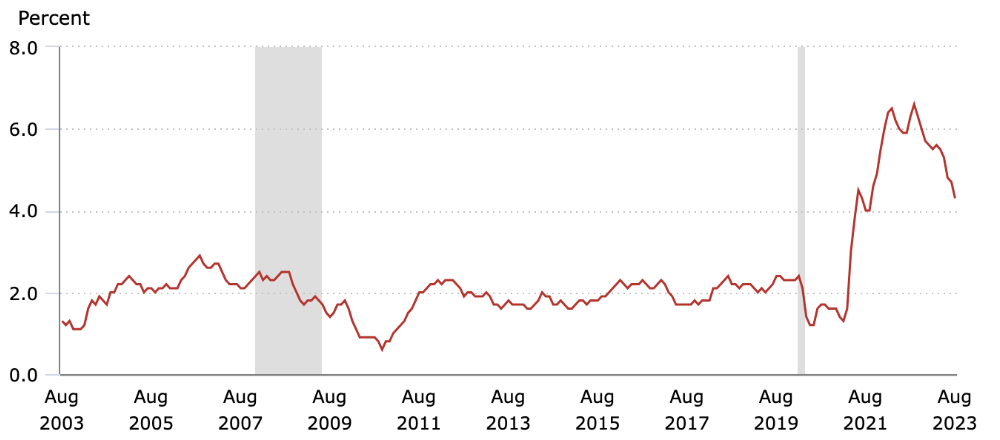
Source: Bureau of Economic Analysis
The Fed’s response was to raise short-term interest rates and to do so dramatically. What followed was a series of rate hikes - 11 so far - that brought the Fed Funds Rate to a target range of 5.25% - 5.50% currently, up from zero at the beginning of 2022.
Fed Funds Target Rate: Fifty Year View

Source: St. Louis Federal Reserve
At the same time, the Fed’s balance sheet has shrunk from close to $8.9 trillion to $8.0 trillion most recently.
The combination of a nearly $1 trillion contraction in the Fed balance sheet, a first-ever (at least since the 1930s) drop in the money supply and elevated rates has contributed to cooling inflation trends with recent core prices rising a more moderate 4.3%.
Most observers, however, expected the economy, and inflation, to cool further and inflation remains significantly above the Fed’s 2.0% target. GDP growth for the first two quarters of 2023 exceeded 2.0%, up from earlier forecasts anticipating half that gain while for the Q3, economists now look for 3.5% growth, up from flat to up 0.5% as recently as June.

Strong employment and wage growth, solid consumer spending supported by a whopping $40 trillion increase in household wealth since 2019, reasonably solid consumer confidence, and rising private investment all contributed to stronger than expected growth. The fact that the unemployment hasn’t budged despite a 20x move in short-term rates is astounding and reflective of both high cash balances on corporate balance sheets (2x pre-pandemic levels) and still strong demand trends.
Recent Employment Trends Have Exceeded Expectations

Producing Relatively Strong Consumer Confidence
Household Wealth Up $40 Trillion Since January 2019

Source: St. Louis Federal Reserve
In addition to strong consumer fundamentals with respect to employment, wages and household wealth, both manufacturing and service economy PMI readings have improved over the past several months.
Institute of Supply Management: Manufacturing and Service Indices Rising

Durable Goods Growth Ahead of Forecast, Positive 5 of Past 6 Months

Durable goods order strength supports the firming read on ISM manufacturing trends; though we find it remarkable that business spending has held up so well in the context of rising rates.
Overall, our point of view is that solid labor market fundamentals will support the economy, headwinds related to rising interest rates notwithstanding.
Credit Markets and Inflation
Stronger economic growth has clearly complicated efforts by the Fed to contain inflation with Chairman Powell suggesting recently that elevated rates might persist through the end of 2024. This signaling prompted a sell-off in the credit markets with ten-year treasury yields rising from 3.6% to a 17-year high of 4.6%. As mentioned, 30-year treasuries declined 12% in price during the quarter as yields, which move inversely to price, advanced 90 basis points to 4.8%.
The Fed’s hawkish stance on rates has raised borrowing costs both for business and particularly for the government which funds deficit spending on a short-term basis. Deficits ballooned during both the Great Financial Crisis and the pandemic but have remained elevated with the deficit expected to nearly double in 2023 to $2.0 trillion.

Source: New York Federal Reserve
The recent pick-up in interest rates has raised speculation that the fixed income “term premium” - the incremental yield demanded by investors holding long-dated securities, might be rising. This “bear steepening” has generally proved negative for equities.
Short-term trading aside, rising deficits pose a structural risk to the U.S. economy and, all else equal, have the potential to squeeze borrowers out of lending markets due to higher interest costs. While there exist numerous rabble-rousers in Congress exhibiting a new found sense of fiscal rectitude, the reality, in our view, is that people at risk of losing their jobs every 2 years aren’t going to make tough decisions. And fixing the deficit problem will be tough.

As shown above, social security, medicare, defense and interest on the debt account for $4.2 out of $6.3 trillion in Federal spending.
Market Implications
Stronger economic growth and sustained high levels of corporate profitability has produced higher than expected earnings thus far in 2023 with S&P 500 EPS expected to rise in excess of 10% for the year to $225. Above-trendline growth is expected for both 2024 and 2025 as well, with EPS estimates of $250 and $270 for those periods.
Based on these estimates, the market is trading at 17.1 times the CY 2024 forecast and 15.8 times the CY 2025 projection. Relative to no-risk short-term treasuries yielding over 5.0%, we think the market is expensive on a relative basis and expect the broader market to remain range bound over the next three to six months.
In our view, the present market environment makes Roanoke’s long-term investment orientation particularly attractive; our ability to identify winning business models over the long-haul, irrespective of macro considerations, which are currently very much in flux, while maintaining the type of diversification that manages volatility, offers our clients the best balance of risk and return.
As always, if we can clarify or elaborate upon our current thinking, please be in touch. We like hearing from you.