
Investment Update Q2 | 23
Q2 Investor Letter
Equity markets posted solid returns during the Q2 with the S&P 500 Index advancing 8.3% and the tech-heavy NASDAQ 100 Index rising 12.8%. Year-to-date, these benchmarks rose 16% and 31%, respectively. Interest rates rose during the quarter, pressuring bond prices (which move inversely to rates), with ten-year treasuries dropping 2.0%.

While sentiment around Fed policy dominated market action during the first quarter, Q2 returns were driven by stronger-than-expected economic growth.
Indeed, economically sensitive sectors such as consumer discretionary, industrials and technology outperformed health care and consumer staples during the quarter. Concentration rose with the S&P 500 Index outperforming its equal-weighted counterpart by 500 basis points during the quarter; the top 7 S&P 500 constituents (Apple, Amazon, Google, Meta, Microsoft, NVIDIA, Tesla) now represent 27% of the overall market, an all-time high. Excluding these names, the market is flat year-to-date and the median stock in the S&P 500 Index is down slightly.
Style-wise, large-cap outperformed small-cap during the quarter with the Russell 1000 Index advancing 8.3% versus a 4.7% gain for the Russell 2000 while growth trounced value - the Russell 1000 Growth Index beat value by 1000 basis points.
On a regional basis, year-to-date, US equities have outperformed Europe, Asia-Pacific and Emerging markets by 300, 700 and 1200 basis points, respectively.
Currently, the S&P 500 Index is trading at 19.7 times the CY 2023 earnings forecast of $225 and 17.8 times the CY 2024 estimate, representing an earnings yield of 5.6%. This compares to the ten-year treasury yield of 3.9% and implies an equity risk premium of 170 basis points, lower than in recent years but in line with the long-term average of 160 basis points; a reversion to the long-term average would suggest a fair value of around 18 times forward earnings and a near-term price target of 4500 for the S&P 500 Index, in-line with current levels.
The Economy
The U.S. economy continues to exhibit remarkable resilience in the face of rising interest rates. First quarter real GDP, initially estimated to have risen 1.1%, is now expected to have advanced 2.0%. Stronger exports, a pick-up in consumer spending, rising government expenditures and robust residential fixed investment drove the better-than-expected results.
Growth is expected to remain solid for the second quarter as well with consensus forecasts projecting 1.0% real growth and the Atlanta Fed GDPNow tracker pegging gains at 2.0%; back in March, most economists were expecting a flat to down performance.
Insofar as personal consumption expenditures account for nearly 70% of GDP, the state of the consumer has an important impact on aggregate economic activity. Consumer confidence has increased sharply, driven by rising wages which continue to advance, though growth has moderated over the past year. Wealth effects from higher equity prices, excess savings - estimated at roughly $500 billion - and a demographically-induced upward spending shift tied to the aging of the baby boom cohort all suggest that this important pillar of growth will continue to support GDP in the quarters ahead.

In addition to strength in the consumer sector, the economy continues to defy expectations of a rate-induced contraction in housing activity. In fact, housing starts accelerated in May to 1.6 million, up 21% from April. Durable goods orders have also surprised to the upside, rising 1.7% in May versus an expectation of a 1.0% decline.

Clearly, any contraction in activity - if it happens at all - will happen later than previously forecasted; from our point of view, it’s difficult to see the basis for a hard landing given solid labor market fundamentals. That is not to say there are no clouds on the horizon.
Indeed, there are several indicators that suggest caution, including:
Institute for Supply Management (ISM) Purchasing Managers Index (PMI)
The PMI measures purchasing manager’s intent to increase capital investment - a reading below 50 indicates contraction in the economy. The most recent figure for June indicated a further decline to 46%, a level that has historically signaled recession.
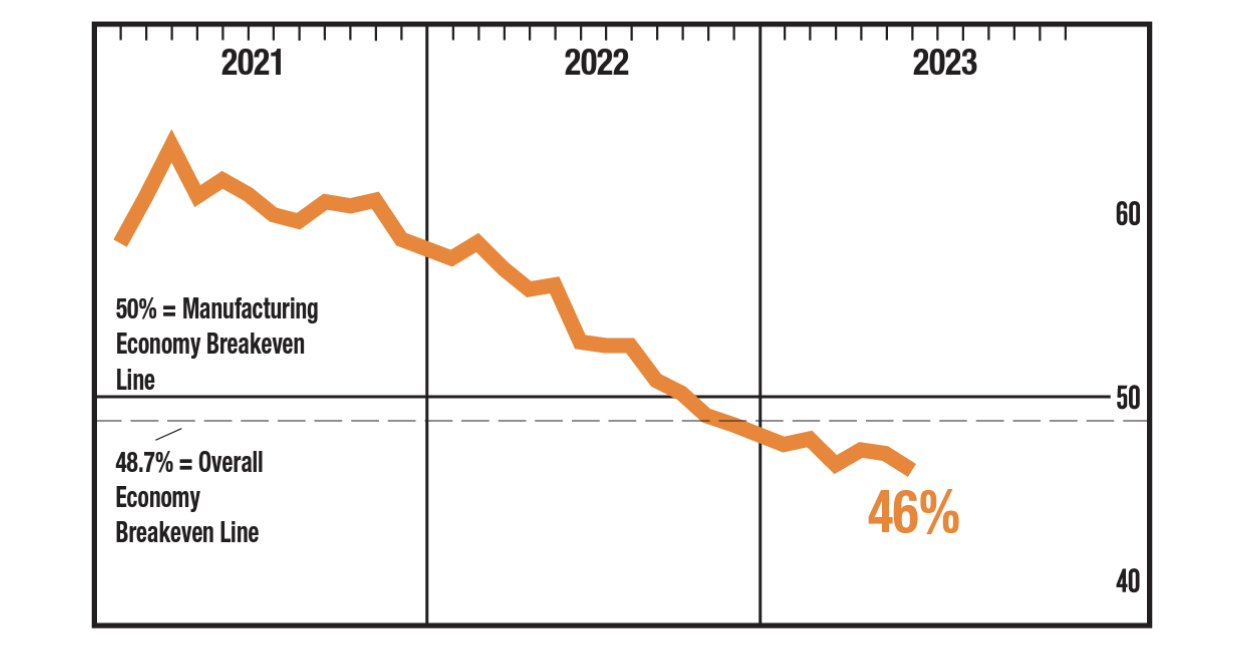
Source: Institute for Supply Management
Yield Curve Inversion
An inverted yield curve suggests that investors expect slower economic growth in the future, leading to more accommodative monetary policy. The current spread between the 2- and 10-year treasury securities is the greatest since 1981.
Ten-Year Treasury Constant Maturity - Two-Year Treasury Contant Maturity
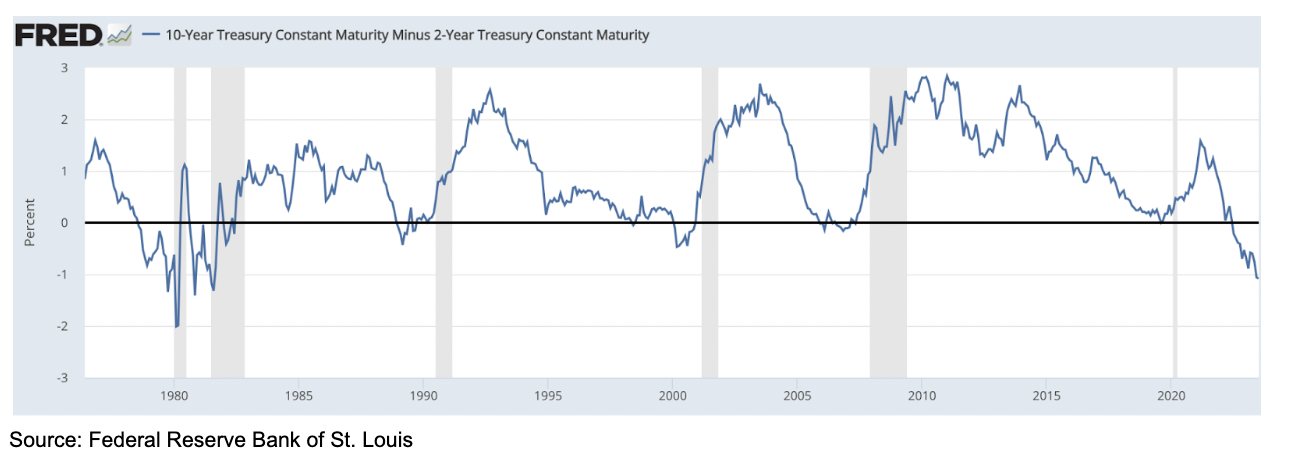
As shown above, an inverted yield curve has preceded each of the past six recessions since 1980 by an average of 15-18 months. This time around, the curve became inverted in June 2022, suggesting that a contraction in the economy could commence by year-end.
Contraction in the Supply of Money (M2)
Money Supply (M2) Hasn’t Contracted Since 1960

As shown above, the money supply, as measured by M2, has contracted sharply following record pandemic-related fiscal and monetary stimulus. In May, M2 shrank 4.6% on a year-over-year basis, an unprecedented drop that could constrain growth, particularly when coupled with what we perceive to be tighter credit conditions following the collapse of First Republic Bank and other mid-sized financial institutions this past spring.
While we see the basis for economic weakness, we think any downturn will be mild due, in large part, to the aforementioned strength in the labor market.
Credit Markets and Inflation
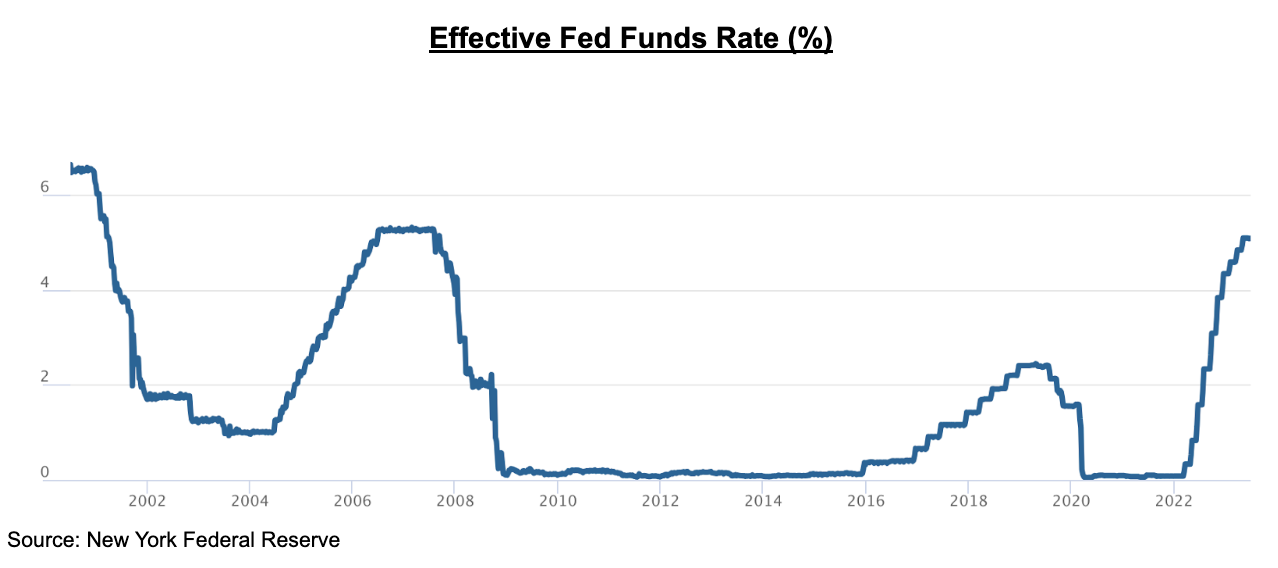
The prospect of stronger economic growth despite sharp hikes in the Fed Funds rate has complicated efforts to contain inflation.
While headline inflation has declined, core CPI remains stubbornly high.

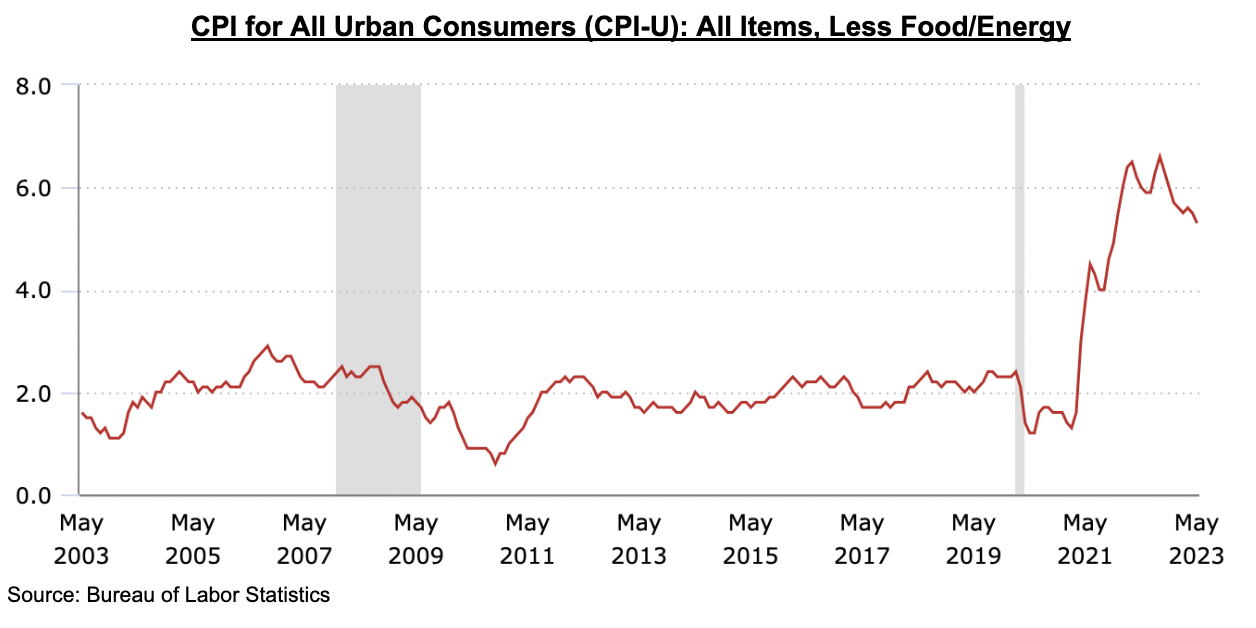
We do expect core inflation to continue moderating through the end of 2023 and into 2024 but see the Fed tightening an additional 25 - 50 basis points before pausing.
Market Implications
At the beginning of the year, the broad consensus held that coordinated rate increases across the globe would constrain economic growth, leading to recession with negative implications for corporate earnings. We thought the consensus view was so widely held so as to be fully incorporated into stock prices, underpinning our constructive stance.
Since then, earnings have held up, rising rates notwithstanding and equity prices have rebounded back into bull market territory. Bears have become more bull-like and investor sentiment has improved to levels not seen since November 2021. Valuations don’t appear overly stretched - the current PE on CY 2024 earnings is right at the 25-year average, though the current equity risk premium is uncomfortably low relative to the risk-free rate. As such, we recommend a balanced approach to portfolio construction, taking advantage of unusually high short-term rates while maintaining exposure to those singular companies best positioned to grow over the long-term.